Joining the National Data Science Challenge
It’s been a crazy month. 9 months ago, I committed to having a baby, and Baby Ethan was born on 11 Mar 19! He has brought me so much joy, even through crying and pooping. Between the nappy changes and feedings, I committed to another baby: the National Data Science Challenge (NDSC) 2019, which was held from 23 Feb 19 to 22 Mar 19. I felt that participating in the NDSC was essential for me to develop my skills in data science and benchmark myself against other data scientists in Singapore. Hence, I teamed up with 3 fellow alumni from the University of Warwick to take a shot at the NDSC.
The Task
Problem Statement
The NDSC was run by Shopee, who provided us with product listing titles and images on beauty, fashion, and mobile products. The task at hand was to predict attributes of these products (see the table below for the full list). Given that the target attributes were categorical, and text data and images were the predictors, this was clearly a classification problem that required Natural Language Processing (NLP) and image processing techniques.
| Beauty Product Attributes | Fashion Product Attributes | Mobile Product Attributes |
|---|---|---|
| Benefits | Pattern | Operating System |
| Brand | Collar Type | Features |
| Colour Group | Fashion Trend | Network Connections |
| Product Texture | Clothing Material | Memory RAM |
| Skin Type | Sleeves | Brand |
| Warranty Period | ||
| Storage Capacity | ||
| Colour Family | ||
| Phone Model | ||
| Camera | ||
| Phone Screen Size |
Furthermore, each product attribute required dedicated treatment. Hence, the task required us to optimise 21 different models - one per product attribute. This implied a lot of work. When we were first briefed on the task, we were uninspired by the lack of social impact and the sheer amount of time and resources it would take to build 21 models. We actually considered dropping out from the NDSC at our first (and only) team meeting. Fortunately, one of my teammates, Shen Ting, was pretty enthusiastic and ran a Random Forest (RF) model on default settings on a random mobile product attribute. It scored over 90% in accuracy. I don’t know about the other teammates, but this inspired me to give the NDSC a go.
The Competition
The competition was run on Kaggle, a platform for hosting data science competitions. Submissions to the NDSC on Kaggle required us to predict the product attributes on a mix of approximately 1,000,000 beauty, fashion, and mobile products. Our leaderboard score was based on the number of correct predictions, with a twist. The evaluation metric was called Mean Average Precision @ 2 (MAP@2). We were allowed two predictions per test sample, and were given a score of 1.0 if the first prediction was correct, regardless of the second prediction, and a score of 0.5 if the first prediction was wrong, but the second was correct. Therefore, we had to use a machine learning (ML) algorithm that provided us with class probabilities.
You can think of the competition as an exam. The training set is equivalent to a 10-year Series booklet of past exam questions. The test set is equivalent to a milestone exam like the PSLE or O Levels. In building a model, you hope to learn the underlying principles of how to solve exam questions (using the 10-year Series) so your skills are applicable to the exam. If you instead memorise solutions to the 10-year Series questions, you might not do well on the exam because minor variations in questions will throw you off.
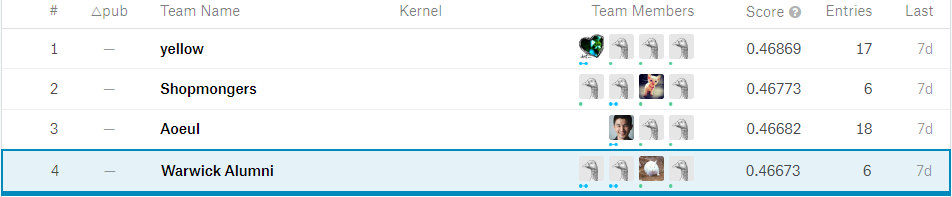
The Outcome
Jumping forward in time, here’s the result: we placed 4th on the Kaggle leaderboard and won the Merit Prize! I was slightly disappointed about the end result because we didn’t make a podium finish, but I was glad we were close. At the ceremony (and on the Kaggle discussion board), we got to learn of complex methods that many teams used. A select few of these teams managed to clinch the top 3 prizes and the Most Creative Solution prize, but many placed below us. I think that we made a real contribution to Shopee because we delivered good predictive accuracy, not far behind solutions that employed neural networks, yet our model was so simple and quick to train. I dare say that our model was the most deployable of the lot.
The Solution
As I mentioned, our solution was extremely simple. We used basic data cleaning techniques, a primitive method for feature extraction, and a primitive ML algorithm for classification. All we needed was good intuition in the models. Let’s begin with data cleaning.
Data Cleaning
For each model, we used only the product listing titles (hereafter referred to as titles), ignoring the images completely. This was because they were non-standardised and would have contributed to a lot of noise in the models. In addition, it would have required a lot of time to train neural networks on the images. Hence, we focused only on text. We did just three things: (1) combined the titles from the training and test sets, (2) dropped missing values and (3) translated some Bahasa Indonesian words to English. We translated only words contained in the product attributes we were predicting. For example, colours were often written in Bahasa Indonesian in the titles, while the labels for the Colour Family product attribute were in English. We made English the base language for all analysis.
The translations made a big impact on our score and ranking. We missed out on translating many words until the very end of the competition. On the final day, we were in 9th place. However, after performing translations on all of the data (we actually missed out translations on a lot of titles), we parachuted into 4th place. The score jumped from 46.5% to 46.8%, which is quite a lot when you’re near the top of the leaderboard.
Feature Extraction
We converted titles (from both the training and test set) and product attribute labels (hereafter referred to as labels) into binary features a.k.a binary term frequency (BTF) using Scikit-Learn’s TfidfVectorizer function. Each binary feature indicated whether a specific N-gram (word or phrase) was present in that title. Therefore, the label BTFs indicated matches between the titles and the correct label, while the title BTFs served as a bank of vocabulary. The former was used to capture more straightforward relationships between the titles and their true labels, while the latter was used to capture more complex relationships between the text in the titles and their true labels.
ML Algorithm
We chose Logistic Regression as our classification algorithm. Specifically, we used a One vs. Rest (OVR) approach for developing models. That is, assuming the target product attribute had k classes, we split the problem into k binary sub-problems. Each sub-problem predicted whether each entry belonged to class k or not. Scikit-Learn’s LogisticRegression class was able to handle this with a single parameter. We also performed basic fine tuning of the C parameter for regularisation to ensure that the models did not overfit to the training data. That was all. No neural networks, no word embeddings, just Logistic Regression.
Results
We fit all of the above into a ML pipeline using Scikit-Learn’s Pipeline class. This facilitated cross validation (CV). We used 5-fold CV to evaluate our pipeline, and obtained MAP@2 scores between 85% and 99%, depending on the target product attribute. On the test set, we obtained a score of only 46%. I suspect that the main reason was a large amount of missing data in the test set, resulting in many ungraded (0.0) scores.
Things That Didn’t Work
On hindsight, the solution was straightforward: it was a textbook text classification approach. However, the bulk of the work was in testing other methods for feature extraction and other ML algorithms and techniques. All in all, we tested the following feature extraction techniques and ML algorithms:
| Features Extracted | Algorithm |
|---|---|
| TF-IDF of Titles | Logistic Regression |
| BTF of Titles | Random Forest (Scikit-Learn) |
| TF-IDF of Labels | Random Forest (LightGBM) |
| BTF of Labels | XGBoost |
| Doc2Vec of Titles (50 features) | Gradient Boosting (LightGBM) |
| Doc2Vec of Titles (100 features) | Support Vector Machines |
| Doc2Vec of Titles (200 features) | Multinomial Naive Bayes |
| Doc2Vec of Titles (500 features) | K-Nearest Neighbours |
| Cosine Similarity to all classes for Doc2Vec 50, 100, 200, and 500 | |
| K-Means Clustering for Cosine Similarity and Doc2Vec 50, 100, 200, 500 |
We also attempted stacking and blending (ensemble techniques), but these failed to beat good old Logistic Regression. It was the simplest, quickest, and best-performing model.
Key Lessons Learnt
Explore Your Data
One thing I could have spent much more time on was exploratory data analysis. As mentioned, I failed to do translations until the very end of the competition. I didn’t look deeper into the features and understand them better. The top team in the competition had carefully analysed the sample IDs and discovered that these captured some element of time. They were then able to generate a new feature that grouped samples by time bins. Meanwhile, I spent just 5 minutes looking at the distribution of IDs before writing this off as useless.
Feature Generation
I could also have spent more time performing feature generation. Once again, the top team generated several new features that gave them a huge edge:
- Using Naive Bayes log count ratios to create an NB-SVM model
- Sample weighting by defining a metric that measured how complete each sample was
- No. of unique words in each title
Better features could have improved our score.
Using Doc2Vec
I have to admit that I employed Doc2Vec wrongly. I trained our Doc2Vec models on the training set titles instead of using a pre-trained Doc2Vec model. Models pre-trained on large corpuses (e.g. Google News) are available online, but I did not know how to implement them at the time. These models are able to recognise the difference between, say, Samsung and Apple, or iPhone X and Galaxy S9. If I had implemented Doc2Vec correctly, we could have possibly created better Doc2Vec features. I’m happy that I learned how not to mess up Doc2Vec for future NLP tasks.
Deep Learning
Frustrated with our low ranking toward the end of the competition, I researched on modern text classification techniques. I discovered that the latest technique for text classification involves feeding word embeddings (from models like Word2Vec, GloVe, or fastText) into a neural network (NN). With no prior knowledge in training NNs, I avoided the approach entirely. However, I am now convinced that to progress in data science, I must venture into deep learning. My ignorance in this area may have cost us a better ranking.
Try, Try, and Try Again
My biggest challenge during this period was pushing through discouraging results. I came up with idea after idea, and tested them only to see them fail in improving our score. But I’m glad that I was able to test and fail the poor ideas quickly so that we could move on to testing other ideas. Repeatedly trying different techniques and not giving up was a key success factor for me. This saying by Thomas Edison sums up this point nicely:
“I have not failed 10,000 times. I have successfully found 10,000 ways that will not work.” - Thomas Edison
Good, But Could Be Better
I felt energised from participating in NDSC 2019. For some time, I’ve heard people talk about data science in such broad strokes, overselling things that I wouldn’t regard as data science, and glossing over things that are core to the field. This caused some disappointment because I think that data science is all about keystrokes. Broad strokes are for politics, keystrokes are for getting things done. Sadly, politics typically trumps model performance, and data science becomes oversold while models remain underoptimised and people remain underdeveloped.
Building a data science capability requires more than speeches and frameworks. It takes practical knowledge to (1) understand the full extent to which data science can be employed, and (2) to know when it can’t be employed. Data science isn’t magic, nor is it a black box (though it sometimes can be). In fact, it’s terribly oversold. Building a strong foundation in data science is actually not that difficult. Some concepts that I’ve written about in this post may seem very technical or foreign to the uninitiated, but a Google search can give you a full explanation of all of them.
In my opinion, it isn’t just the people who will use these skills that must be competent. Leaders who make executive decisions involving data science must know more and know better than the rest. How else can they carefully define the boundaries of how and when we employ data science for good? That is exactly why the Chief Data Scientists in leading tech companies are all PhD holders in mathematics or statistics or computer science, or have an established track record in the practice. They know how best to exploit data science to achieve business ends. In essence, to develop a data science capability, an organisation must have people at all levels in the hierarchy with a strong foundation in the field.
I don’t have a solution on how to build a data science capability, I just know a little about the field. The best that I can do is develop myself as a data scientist and patiently await the day where competence and model performance trump politics. Through the NDSC 2019, I learnt a lot about approaches for text classification, gained new perspective on the direction I should take to develop my abilities in data science, and received timely validation that my personal development was not in vain. I’m happy with the result, but I want to do better. Hopefully, I’ll enter next year’s NDSC in a stronger position and achieve a better ranking.