Schooling: By the Numbers
Joseph’s Schooling’s recent performance at the Tokyo Olympics sparked a huge reaction. Having won the 100m Butterfly at the Rio Olympics in 2016, it seemed that people expected Schooling to replicate his success in Tokyo. There were numerous snide remarks (most have been deleted) and expressions of disappointment. However, it was heartening to see many messages of support. Supportive netizens shut down the toxic ones by empathising with how difficult it was to perform consistently at a top level. But “expert” commentators also weighed in, casting doubt on Schooling’s status as a world-class athlete. Were expectations of Schooling fair in the first place? Was it fair to say Schooling wasn’t as consistent as other world-class athletes?
This post uses data on Olympic games results and Fédération Internationale De Natation (FINA) athlete rankings and timings to show that:
- The expectation for Schooling to win a medal in back-to-back Olympics was unrealistic
- Schooling was indeed world-class
Disclaimer: I am not an athlete, and I don’t know what it’s like to compete in the Olympics. But I do know a little about how to work with data and how to plot some charts. It turns out that that’s all you need to know to get a clearer picture of Schooling’s achievements - one that has yet to be presented in any commentary.
Podium Finishes in Consecutive Olympic Games
While we can easily find reports on athletes who have won medals in back-to-back Olympics, we don’t see the huge number of athletes that don’t. As such, it’s difficult to form realistic expectations of our own athletes’ performance, and we end up forming these expectations with our hearts, not our heads. To ground our expectations in what is typically the case, we use this dataset on Olympic games medalists to investigate how common it is for athletes to win medals in back-to-back Olympic games. Hereafter, we refer to these as repeated wins, and the percentage of medal winners who won a medal in the same event at the subsequent Olympic games as the repeated win rate.
The data contained basic information about athletes’ achievements in the Olympics from 1896 to 2016. A sample is provided in the table below. For the purposes of this post, we limit our analysis to male athletes’ achievements in individual events in Olympic games from 1956 to 2016, the latest year in the dataset. The starting year of 1956 was chosen because it was the first year with records for the Butterfly event.
| Name | Sex | Age | Height | Weight | Team | NOC | Year | Season | City | Sport | Medal | Event |
|---|---|---|---|---|---|---|---|---|---|---|---|---|
| A Lamusi | M | 23 | 170 | 60.0 | China | CHN | 2012 | Summer | London | Judo | Nil | Judo Extra-Lightweight |
| Jyri Tapani Aalto | M | 31 | 172 | 70.0 | Finland | FIN | 2000 | Summer | Sydney | Badminton | Nil | Badminton Singles |
| Minna Maarit Aalto | F | 30 | 159 | 55.5 | Finland | FIN | 1996 | Summer | Atlanta | Sailing | Nil | Sailing Windsurfer |
| Minna Maarit Aalto | F | 34 | 159 | 55.5 | Finland | FIN | 2000 | Summer | Sydney | Sailing | Nil | Sailing Windsurfer |
| Timo Antero Aaltonen | M | 31 | 189 | 130.0 | Finland | FIN | 2000 | Summer | Sydney | Athletics | Nil | Athletics Shot Put |
Repeated Wins Across Sports
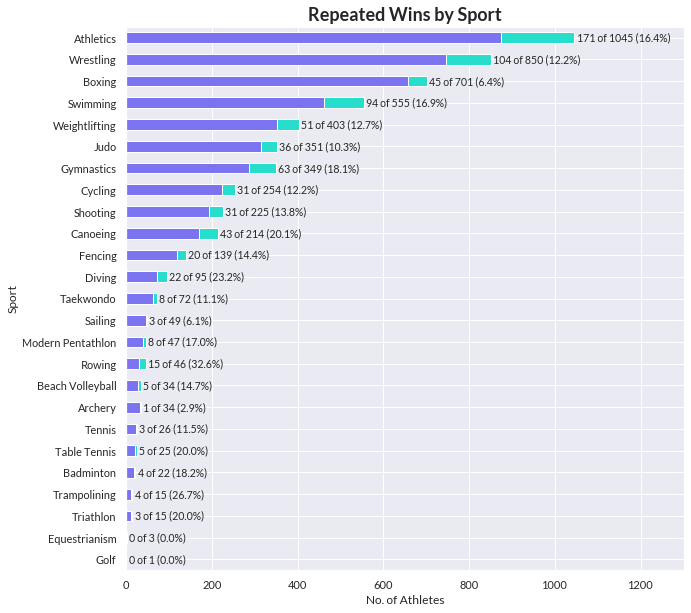
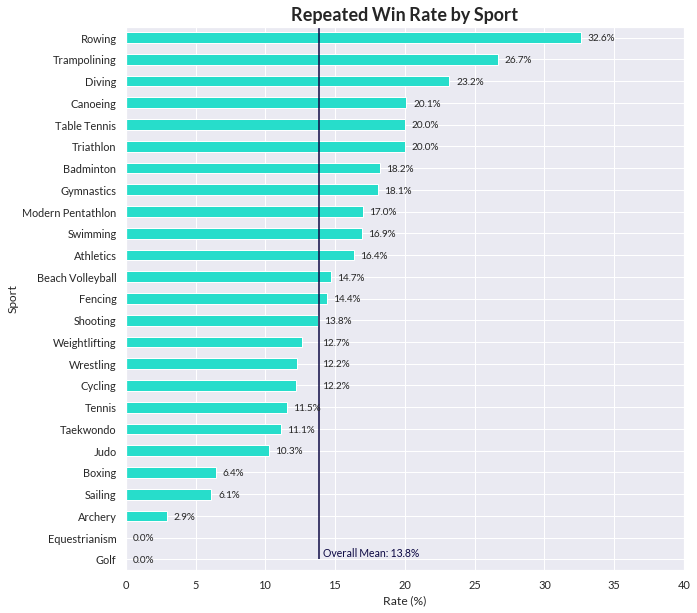
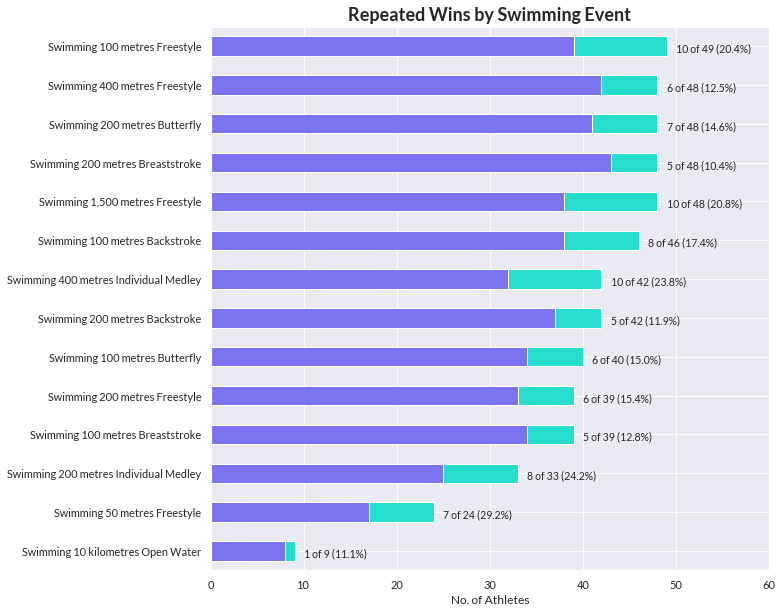
First, we look across the various Olympic sports. The first plot shows the counts of (1) medal winners who achieved a repeated win (green) and (2) medal winners who did not (purple). The second plot shows the repeated win rates in different sports.
We make two observations here:
- Odds seem to be stacked against defending champions.
- Different sports appear to have different repeated win rates.
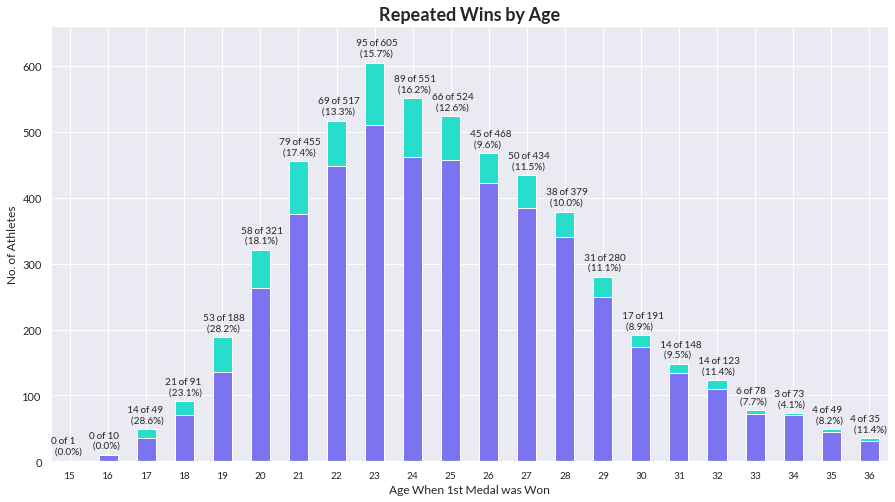
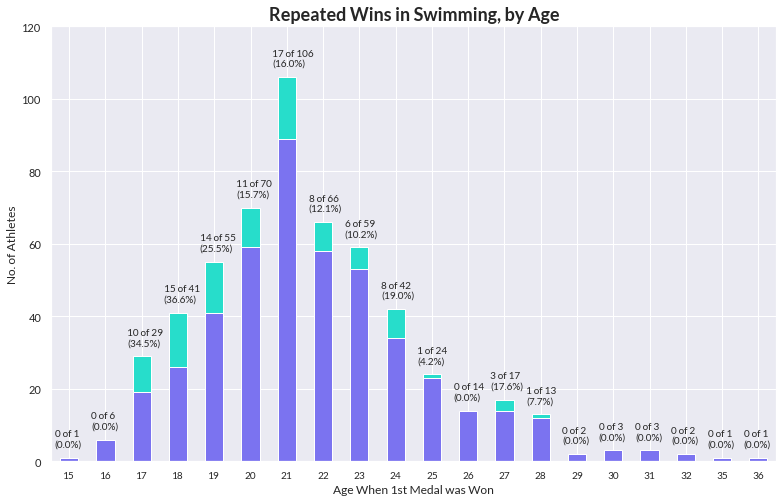
Repeated Wins Across Ages
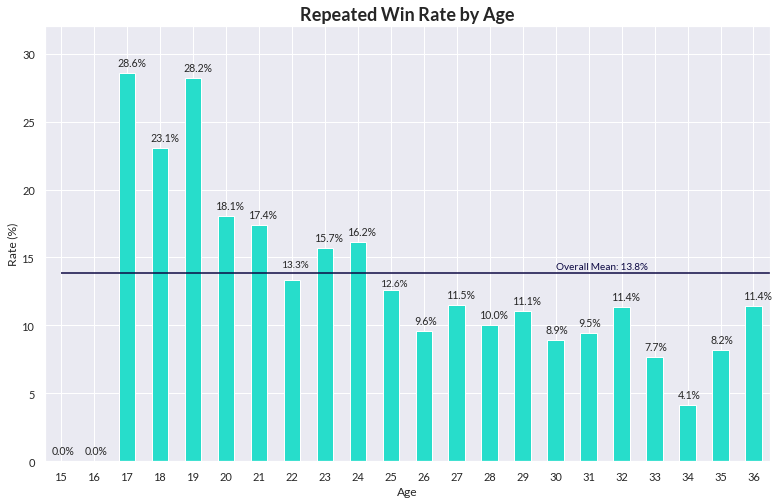
Second, we look across ages. The two plots report the same statistics as above. It is clear that:
- Judging by the counts in the first plot, age 22 to 25 appears to be where athletes are in their prime
- The younger a male athlete is (at least until age 17), the higher the repeated win rate.
Sidenote: I ran several logistic regression models to assess the statistical significance of sport and age on repeated win probability. The model fit was extremely poor, and confidence intervals were extremely wide. There would not be much value in using these models for inference. Hence, I omitted them from this post.
Repeated Wins in Swimming
Now we know that an athlete’s sport and age may have an impact on the chances of a repeated win, we slice the data further, zooming in on swimming. We take the same approach as above, plotting the counts and rates to get an overview of the differences across swimming events and ages.
Below, we see that there is some variation in repeated win rates across different events. On one end, we have the 200m Breaststroke with a relatively low win rate of 1 in 10, and on the other, we have the 100m Freestyle with a relatively high win rate of 1 in 5. The 100m Butterfly sits somewhere in the middle at 15%.
The plot below echoes the finding from the previous sub-section: repeated win rates differ across ages. In addition, looking at the total counts (the full length of the stacked purple and green bars), we note that the age where swimmers achieved peak performance appears to be 21. This holds true for the 100m Butterfly, which we focus on in the next section.
Repeated Wins in the 100m Butterfly
Next, we zoom in yet again, this time on the 100m Butterfly. We find that no male swimmer in history has won a medal at age 21 in the 100m Butterfly, and then again at the following Olympic games. In fact, there were only six instances across all age groups where this was achieved, and there were only four names: Spitz, Nesty, Phelps, and Le Clos.
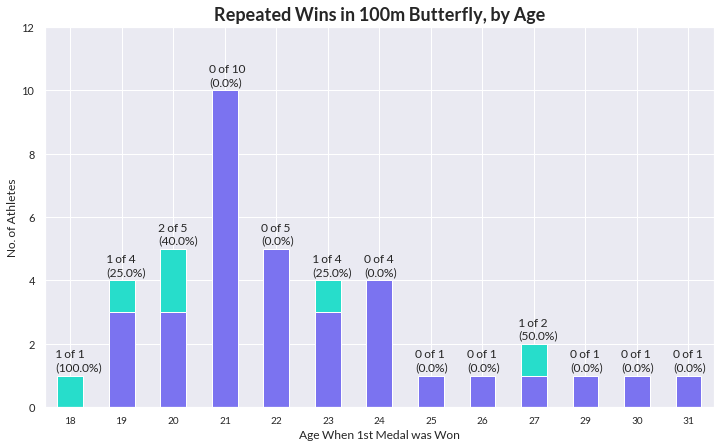
We’ve narrowed down the data as far as we can and still only have wide ballpark estimates for the 100m Butterfly repeated win probability: (a) about 15% if you lump all age groups together, and (b) 0% if you don’t. These aren’t very reliable numbers. The key takeaway from this first section is that repeated wins are not impossible, but the odds of achieving them are stacked against athletes. Although the data may not be able to give us a precise estimate, it is enough to tell us that repeated wins are the exception rather than the norm.
We can ground our expectations in reality by looking at more data, more frequently. Four years is enough for new world champions to be nurtured, hence we ought to look at athletes’ performance between Olympic games. It doesn’t make much sense to use our athletes’ performance in past Olympics to form an expectation of them in the current Olympics.
World-Class Consistency
This section aims to address the question of whether Schooling was world-class. Commentators compared Schooling to Anthony Nesty, who won the gold medal in one Olympic games, and went on to win another medal in the next. They implied that something went wrong in Schooling’s journey, and that Schooling was not on “the sort of trajectory that one expects from a world-class athlete” (Wong, 2021).
If commentators were referring to trajectory as the pattern of repeated wins, we’ve already seen in the previous section that swimmers who achieved this were few and far between. Commentators would be hard-pressed to find another example. In fact, the only other person who achieved the same feat as Nesty in the entire 60-year (15 Olympic games) history of the 100m Butterfly was Michael Phelps, a far outlier in the sport. They might as well have asked, “Why didn’t Schooling reach Phelps’ level? Where did he go wrong? Why is our system so broken that we can’t produce a swimmer like Phelps?”
If these commentators were instead referring to the pattern of performing at a high level, they may have been entirely incorrect to argue that Nesty achieved world-class consistency and Schooling didn’t. Let’s look at the data.
The Fédération Internationale De Natation (FINA) publishes data on swimmers’ competition timings and rankings. Records for the 100m Butterfly were used for the analyses in this post. From here on out, “swimmers” will refer exclusively to 100m Butterfly swimmers.
A Note on Timings
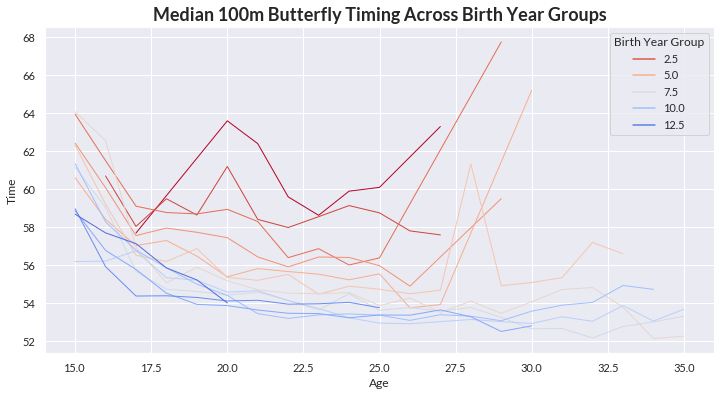
The comparison will be based on competition rankings and not timings. This is because swimmers have been getting faster and faster, hence, the later you’re born, the faster your timing is likely to be. Comparing rankings is a fairer measure of consistency because it is less affected by the era you were born in.
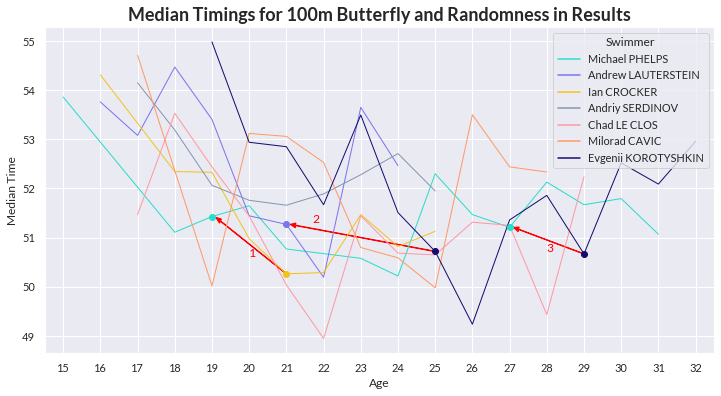
We divided swimmers based on their birth year into 14 five-year bands from 1941 to 2010. The median 100m Butterfly timings were then compared. The darker red lines represent the timings for groups of swimmers who were born longer ago, while the deeper blue lines represent those for groups of swimmers who were born relatively recently. Not only do we see a trend of swimmers who were born later getting faster; they were also competing until an older age. Therefore, for fair comparisons between swimmers, we should line their performance up age for age.
In this second plot, I plot the median timings for selected swimmers at each age. Here are three examples where swimmers had a faster median timing for the year, but still lost in the Olympics in that same year. The arrows point from the losers to the winners.
- Ian Crocker (Silver) vs. Phelps (Gold) in Athens, 2004
- Korotyshkin (No medal) vs. Lauterstein (Bronze) in Beijing, 2008
- Kototyshkin (Silver) vs. Phelps (Gold) in London, 2012
A fast timing on one competition day that wins a medal need not correspond with a consistent performance over the year. Meanwhile, consistency in competition ranking throughout the year does not depend as much on abnormal performance or luck, provided the swimmer participated in enough competitions. For this reason, we make comparisons based on competition ranking.
Schooling vs. Nesty
We compare Schooling’s median competition rankings for the 100m Butterfly event with Nesty’s. Schooling outperformed Nesty early on, but declined faster. Both of them dominated in international and regional competitions during the prime ages of 19 to 23. However, there was a big difference in the number of competitions they took part in.
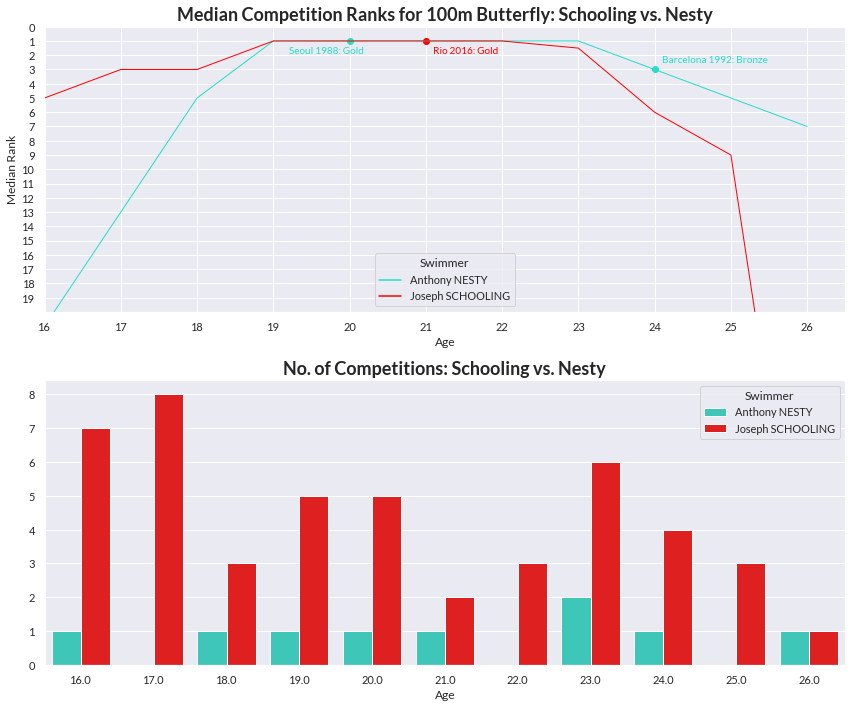
Nesty was unbeaten, but took part in a mere seven competitions from age 18 to 24. Schooling competed in 28, and maintained a median rank of 1 almost all the way through. Schooling has never won the World Championships, but he won regionals (Asian and SEA Games) and numerous competitions in the US against powerhouses like Phelps and Lochte. A friend of mine made the sharp observation that there could have been fewer competitions held in Nesty’s time. While that is understandable, the fact remains that Schooling was tested in substantially more (4x) competitions than Nesty. Also, I’m not exactly sure if there were elite swimmers like Phelps and Lochte competing against Nesty in 1987-1992. Surely there was no competitor back then that won as many medals as Phelps in Schooling’s era.
Another difference between Nesty and Schooling was the alignment of the consecutive Olympic games to their prime years. For Nesty, these lined up almost perfectly. He competed in Seoul at the age of 20 in 1988, and then in Barcelona at the age of 24 in 1992. On the other hand, Schooling won the gold at the historical optimum age for peak performance of 21 in Rio 2016, but due to COVID-19, was forced to defend his title at age 26, a good 2 years after the prime years. And as we have seen throughout the post, age is negatively correlated with medal win rates.
Even if we can’t accept these qualitative differences, we have to acknowledge that the trajectories for Nesty and Schooling look similar. Both of them:
- Rose in rank from age 16 to age 19, hitting rank 1
- Maintained rank 1 until around age 23
- Dipped in rank from age 24 onwards
The huge dip in Schooling’s rank can be explained by a single outlier: Tokyo 2020. Schooling turned 26 in June, just before the Olympics. Hence, his 44th place rank in Tokyo was the only competition at age 26. We should take this data point with a pinch of salt.
Overall, if Nesty exhibited world-class consistency, then surely so did Schooling.
A Fairer Comparison
But of course, it’s superficial to compare Schooling against just one other swimmer. A proper analysis ought to compare Schooling against a broader range of competitors, and we will do exactly that. I’ve shortlisted all previous 100m Butterfly Olympic medalists who had at least five FINA swim records. The full list is provided in the table below.
| Name | Age | Medal | Games | City |
|---|---|---|---|---|
| Lszl Cseh, Jr. | 30 | Silver | 2016 Summer | Rio de Janeiro |
| Joseph Isaac Schooling | 21 | Gold | 2016 Summer | Rio de Janeiro |
| Chad Guy Bertrand le Clos | 24 | Silver | 2016 Summer | Rio de Janeiro |
| Michael Fred Phelps, II | 31 | Silver | 2016 Summer | Rio de Janeiro |
| Michael Fred Phelps, II | 27 | Gold | 2012 Summer | London |
| Yevgeny Yevgenyevich Korotyshkin | 29 | Silver | 2012 Summer | London |
| Chad Guy Bertrand le Clos | 20 | Silver | 2012 Summer | London |
| Milorad avi | 24 | Silver | 2008 Summer | Beijing |
| Andrew George Lauterstein | 21 | Bronze | 2008 Summer | Beijing |
| Michael Fred Phelps, II | 23 | Gold | 2008 Summer | Beijing |
| Michael Fred Phelps, II | 19 | Gold | 2004 Summer | Athina |
| Ian Lowell Crocker | 21 | Silver | 2004 Summer | Athina |
| Andriy Viktorovych Serdinov | 21 | Bronze | 2004 Summer | Athina |
| Lars Arne Frlander | 26 | Gold | 2000 Summer | Sydney |
| Michael George Klim | 23 | Silver | 2000 Summer | Sydney |
| Geoffrey Andrew "Geoff" Huegill | 21 | Bronze | 2000 Summer | Sydney |
| Vladislav Vladimirovich Kulikov | 25 | Bronze | 1996 Summer | Atlanta |
| Denis Vladimirovich Pankratov | 22 | Gold | 1996 Summer | Atlanta |
| Scott Andrew Miller | 21 | Silver | 1996 Summer | Atlanta |
| Rafa Marek Szukaa | 21 | Silver | 1992 Summer | Barcelona |
| Pedro Pablo Morales, Jr. | 27 | Gold | 1992 Summer | Barcelona |
| Anthony Conrad Nesty | 24 | Bronze | 1992 Summer | Barcelona |
| Andrew David "Andy" Jameson | 23 | Bronze | 1988 Summer | Seoul |
| Anthony Conrad Nesty | 20 | Gold | 1988 Summer | Seoul |
| Matthew Nicholas "Matt" Biondi | 22 | Silver | 1988 Summer | Seoul |
| Michael Gro | 20 | Gold | 1984 Summer | Los Angeles |
| Pedro Pablo Morales, Jr. | 19 | Silver | 1984 Summer | Los Angeles |
| Pr Johan Arvidsson | 20 | Gold | 1980 Summer | Moskva |
| Roger Pyttel | 23 | Silver | 1980 Summer | Moskva |
| David Lpez-Zubero Purcell | 21 | Bronze | 1980 Summer | Moskva |
| Joseph Stuart "Joe" Bottom | 21 | Silver | 1976 Summer | Montreal |
| Mark Andrew Spitz | 22 | Gold | 1972 Summer | Munich |
| Bruce Richard Robertson | 19 | Silver | 1972 Summer | Munich |
| Mark Andrew Spitz | 18 | Silver | 1968 Summer | Mexico City |
Swimmers who were omitted because of a lack of data were:
- Ross Wales
- Douglas Russell
- Jerry Heidenreich
- Matt Vogel
- Gary Hall
- Glenn Buchanan
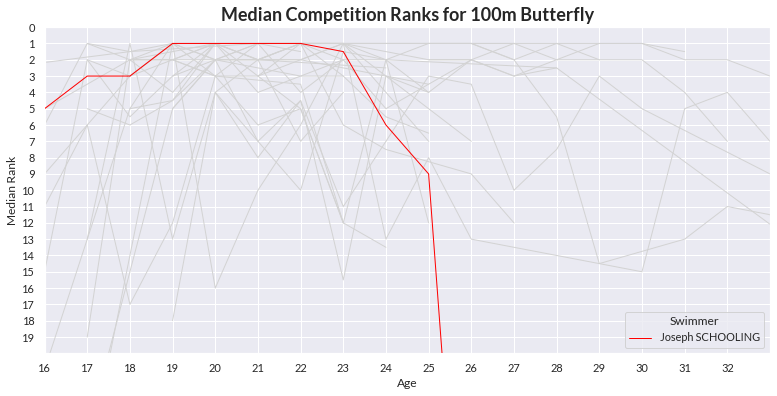
The plot below shows the trajectories in median competition rank for all the (unique) 26 swimmers in the list above plus Schooling. The broader patterns appear to be the following:
- Most swimmers reach a rank close to their career high at about age 19 or 20.
- They fluctuate around that rank until age 22, where a large number of them dip in rank. The better ones hold their rank until age 23 before dipping. Most swimmers in these two groups will not reach a median rank of 1 again.
- A rare few (Phelps, Le Clos, and Cseh) maintain rank 1 until a relatively old age.
Looking at the huge dips in median rank for most of the swimmers, we could argue that Schooling was among the more consistent ones during the prime period. Performance at age 25 is difficult to compare, since most swimmers stop competing in the 100m Butterfly entirely.
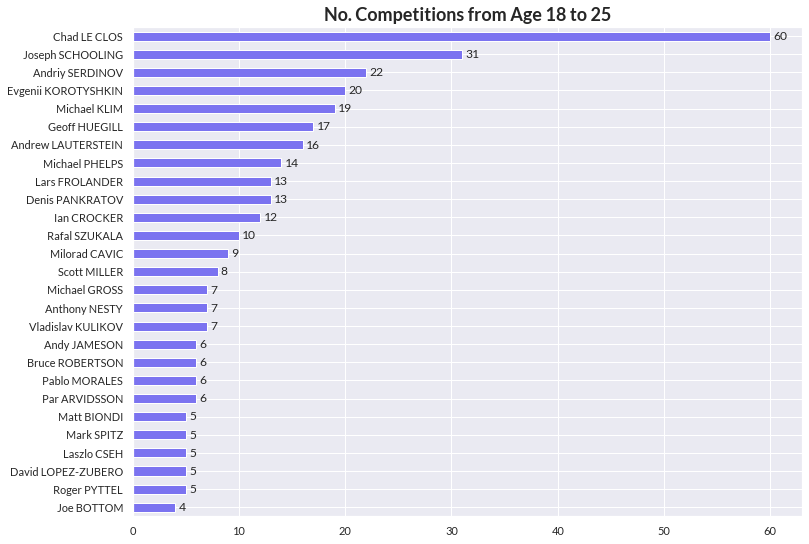
In addition, Schooling participated in quite a large number of competitions around the prime years. An interesting observation is that the bigger names only ramped up their participation in competitions later on, with the exception of Le Clos who was spoiling the market (and my chart).
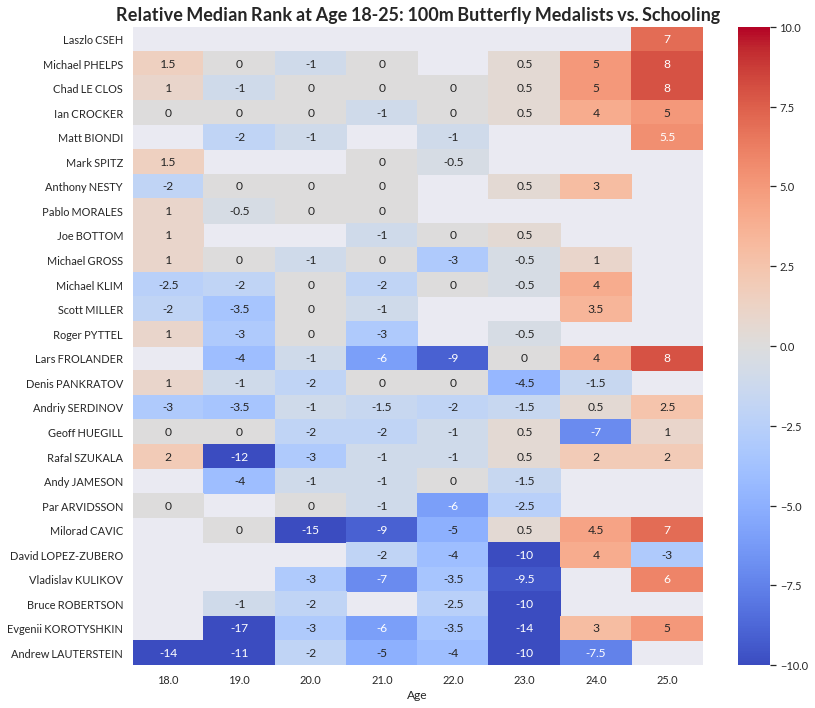
To compare Schooling’s relative performance, we plot a heatmap of Schooling’s median rank relative to that of all the 26 selected swimmers. The difference in rank is indicated in each cell. Darker red cells indicate stronger performance against Schooling, while darker blue cells indicate weaker performance against Schooling. Blank cells indicate that that swimmer did not compete at that age.
We see that from age 19 to 23, Schooling actually matched the median rank of great swimmers like Le Clos and Phelps, and outperformed a large number of the others. Again, we see that Nesty’s performance was comparable.
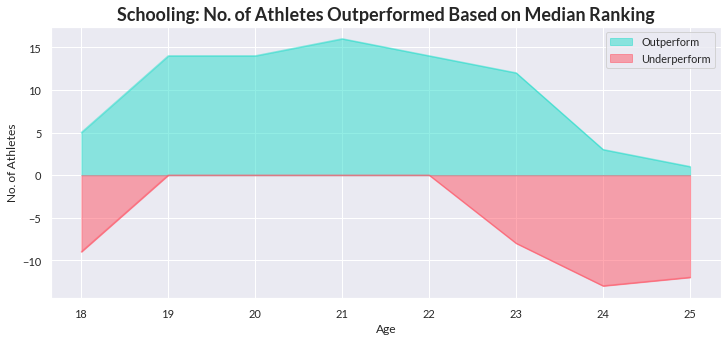
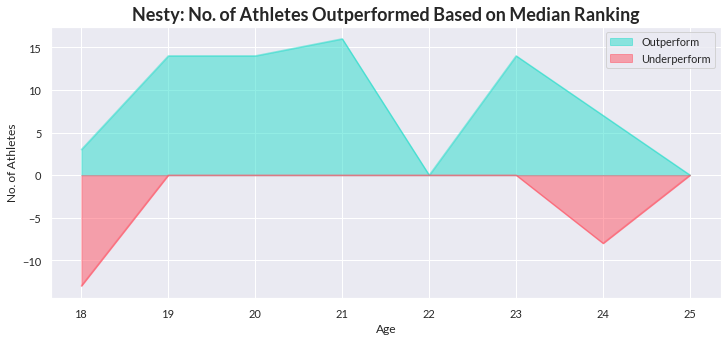
Schooling’s performance can also be dissected into the number of 100m Butterfly medalists he outperformed and underperformed based on median competition rank. Once again, we see that his “trajectory” looked similar to Nesty’s. Both of them had their prime years from age 19 to 23.
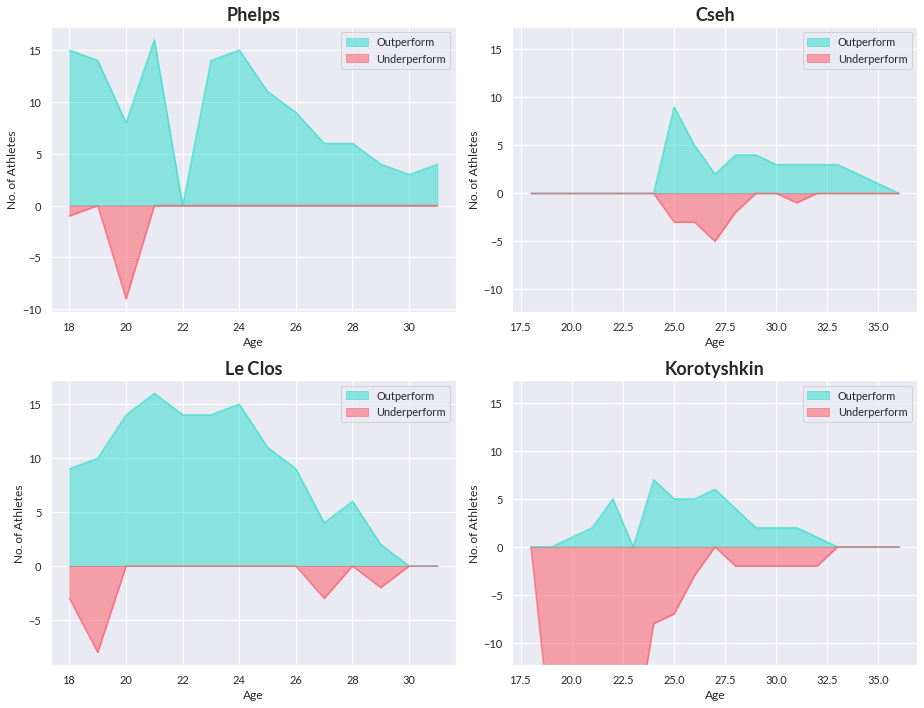
For reference on what the outliers looked like, these are the equivalent plots for Phelps and Le Clos, who dominated until about age 30, and Cseh and Korotyshkin, who continued performing well into their early thirties.
This concludes the section on rankings. The first point here is that it’s not entirely fair to compare Schooling against Nesty just because they both won gold medals in the 100m Butterfly. If we lined Nesty’s and Schooling’s achievements up by age, Schooling had a similar trajectory despite being tested more rigorously through a larger number of competitions. Second, the data shows that Schooling outperformed a large number of other 100m Butterfly medalists. This was measured both in terms of relative median ranking and raw counts of other swimmers he outranked.
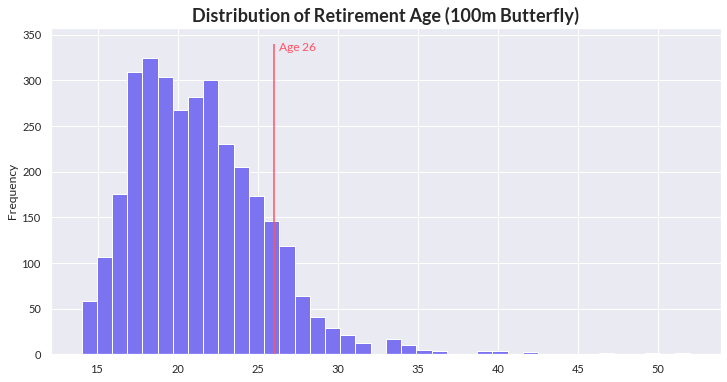
Looking Forward: Age Will Catch Up
Before we conclude, I’d like to present two relevant plots on age to help calibrate expectations. This year, Schooling is 26. Historically, about 86% of swimmers retired from competing in the 100m Butterfly before age 26. The plot below shows the distribution of retirement age, defined as swimmers’ age at their last activity tracked by FINA. If Schooling chooses to continue (and this is none of our business), he would be among the most perservering athletes in the sport, joining the likes of Laszlo Cseh, Le Clos, and Phelps.
And if Schooling decides to continue (again, none of our business), know that it would be difficult for him to match his timing when he was 21. Historically, 100m Butterfly timings have decreased with age. The plot below makes it look like timings decrease until age 29. The truth is that the slower swimmers stop competing earlier, leaving only the best ones behind. This in turn gradually lowers the average until the fast ones eventually slow down. No athlete can escape the effect of age, and we should calibrate our expectations appropriately.
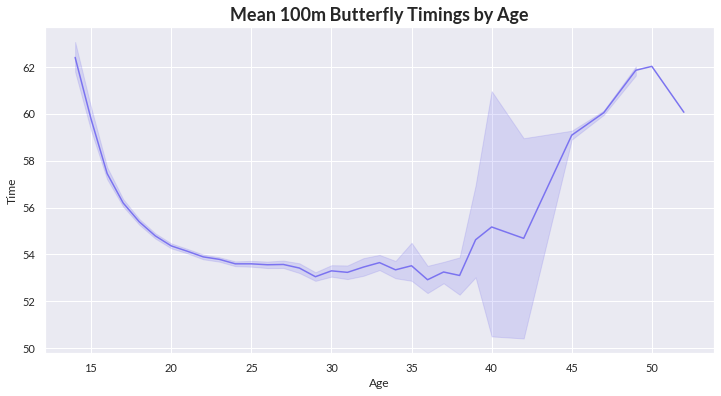
But of course, these are just historical averages. Every athlete is unique, and it is difficult to anticipate how athletes will continue to develop in future. We can only give them resources and our support, and get out of the way so they can do what they do best without negativity weighing them down.
Conclusion
In this post, I have attempted to provide a more comprehensive analysis of Schooling’s performance than there is currently available to investigate whether expectations of him were fair, and whether he was as consistent as other world-class athletes.
First, I showed that the odds for Schooling to win another medal in Tokyo were stacked against him. Repeated wins were not impossible, but they seemed to be the exception rather than the norm. I noted that what happens between Olympic games is important, hence it makes no sense to use performance in past Olympics to form an expectation of performance in the current and future Olympics.
Second, I used comparisons of competition rankings to show that Schooling was indeed world-class. The data showed that Schooling’s trajectory in terms of median rank was above the average compared to all 100m Butterfly medalists in Olympic history. In addition, his record was arguably better than Nesty’s. If “experts” are praising Nesty for world-class consistency, they’d better be praising Schooling too. Perhaps, Schooling’s trajectory is the “sort of trajectory that one expects from a world-class athlete”.
Overall, if the expectation of a repeated win for Schooling was unrealistic, if Schooling demonstrated world-class consistency, and if his trajectory was better than comparable champions in the 100m Butterfly, maybe there isn’t very much we need to talk about after all. What’s important is that we do our due diligence to analyse the data, form an opinion grounded in facts, and present an accurate and logical narrative, not one that simply meets our political agenda.
I know I may have gone overboard in crunching the numbers. I hope I’ve done Schooling some justice by breaking down his performance and presenting him as the world-class athlete he is.
@Schooling: You’ll always be our champion!
References
- CNA, Facebook
- G. Wong, Commentary: We need to talk about why Joseph Schooling crashed in Tokyo (2021), CNA
- R. Griffin, 120 years of Olympic history: athletes and results, Kaggle Datasets
- I. de Cotta, Singapore sports must learn lessons from Schooling’s decline (2021), TODAY
- Fédération Internationale De Natation (FINA)
Credits for image: Unreserved Media